


 US and commercial hours hit year-to-date highs
 IT hours reach new high point for 2026
 Light industrial hours at highest level of 2026 for third straight week
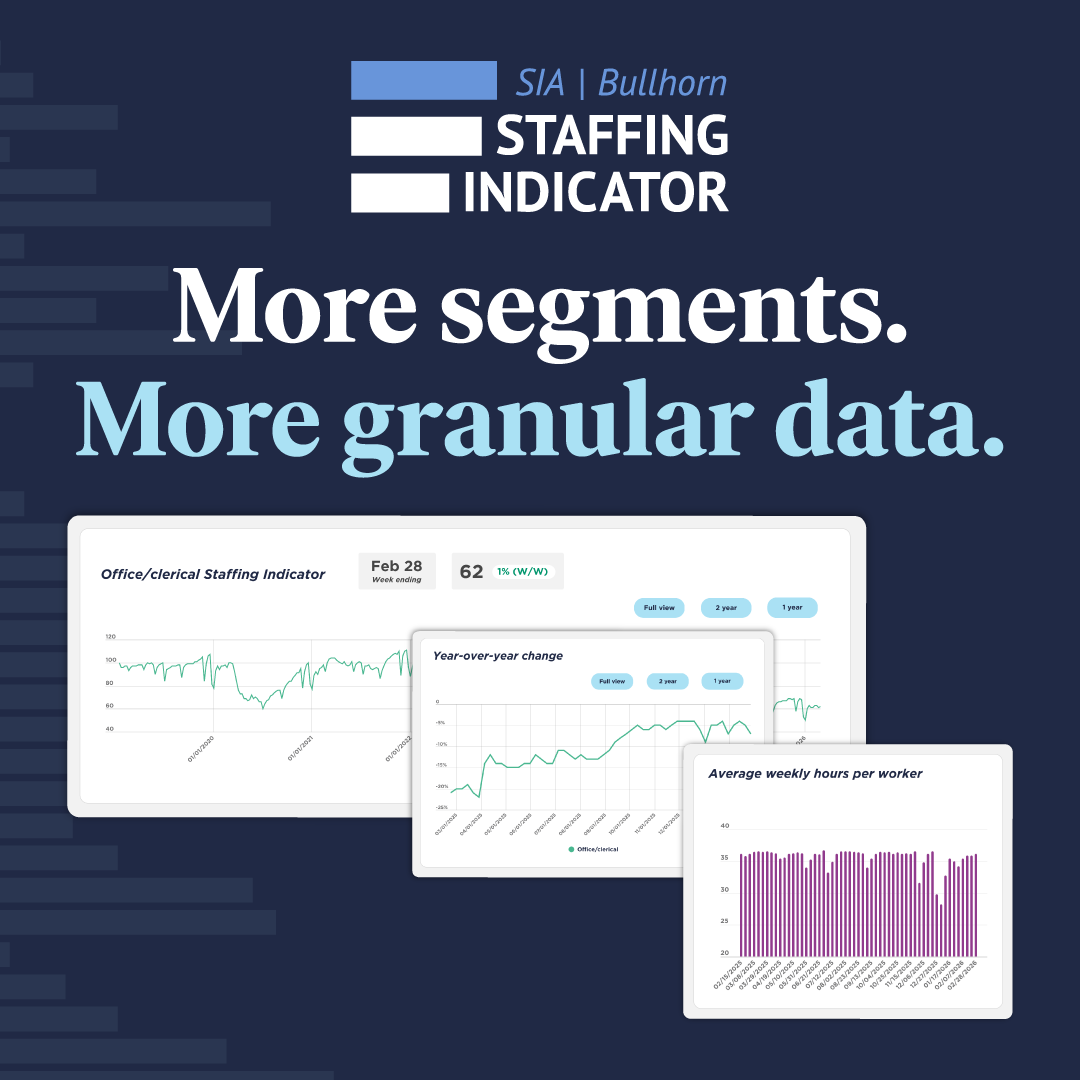
 Office/clerical hours still well below 2025
About the SIA Bullhorn Staffing Industry Indicator
The SIA | Bullhorn Staffing Indicator is a unique tool for gauging near real time weekly trends in the volume of temporary staffing delivered by staffing firms. Each week the Indicator reports data for the week that ended ten days prior to the release. It reflects weekly hours worked by temporary workers across a sample of staffing companies in the US that utilize Bullhorn’s technology solutions. The Indicator is weighted and benchmarked against US Bureau of Labor Statistics data to approximate the composition of the staffing industry by skill. While the indicator does not presume to perfectly reflect the entire universe of staffing firms, it does represent a sizable sample of the staffing industry, reflecting a wide range of occupations, client industry verticals, and geographic footprint that spans the country.
The Indicator can be used by staffing firms to benchmark their past and current performance, as well as a tool for forecasting near term industry trends and outlook.
As the US temporary staffing industry has often functioned as a co-incident indicator for the US labor market and economy, the SIA | Bullhorn Staffing Indicator is also useful for a broader audience of business leaders and investors who are seeking real-time insight.
The Indicator is a joint custom research effort between Bullhorn and industry advisor Staffing Industry Analysts.
Revisions and Technical notes on the SIA | Bullhorn Staffing Indicator
We note the readings for the last 4 weeks are subject to revision and so should be viewed as preliminary, with the reading for the last recorded week the most likely to be revised in next week’s data release. For further information on how the Indicator has been created and detailed technical notes please refer to the methodology.

")

")

