Using Bullhorn Analytics to clean your data

Are you getting ready to give your ATS a spring clean, preparing for AI, or doubling down on the idea that data is the best foundation for making good business decisions?
Here are our top tips for using Bullhorn Analytics to improve your data quality throughout Bullhorn.
Data quality metrics
Bullhorn Analytics comes with a full suite of data quality metrics, giving you a heads-up that everything is not quite what it might seem.
Have you ever had the sneaking suspicion that your team’s very full jobs pipeline, with its dreamy high expected value, is not quite true to life? I suggest checking out the Jobs Open More Than 100 Days metric.

The majority of those 180 open jobs should be marked as closed, which will help your data more accurately reflect what’s really going on.
Or maybe you’re catching on that someone on your team isn’t quite as on top of their admin as they would like you to believe. Metrics like Placements With 0 Value and Perm Placements Time To Fill < 1 Week will highlight where someone may be cutting corners.
If you click into a metric, it will bring up the Data Details Clickthrough. This will show you the details of the offending record, and you can even click on any of the blue links to take you to that record in Bullhorn.

On Bullhorn Enterprise edition, these can be tweaked by our Support team as well.
Maybe your company does some deals with a fee higher than 30%, or your time to fill is occasionally under a week. Our Support team will be happy to change this metric to suit your business better. Please note that larger and more complex changes to your metrics may not be possible or may be chargeable work.
If you are on Bullhorn Growth or Corporate editions, you will still have access to Data Quality metrics but a smaller selection.
Slice & Dice
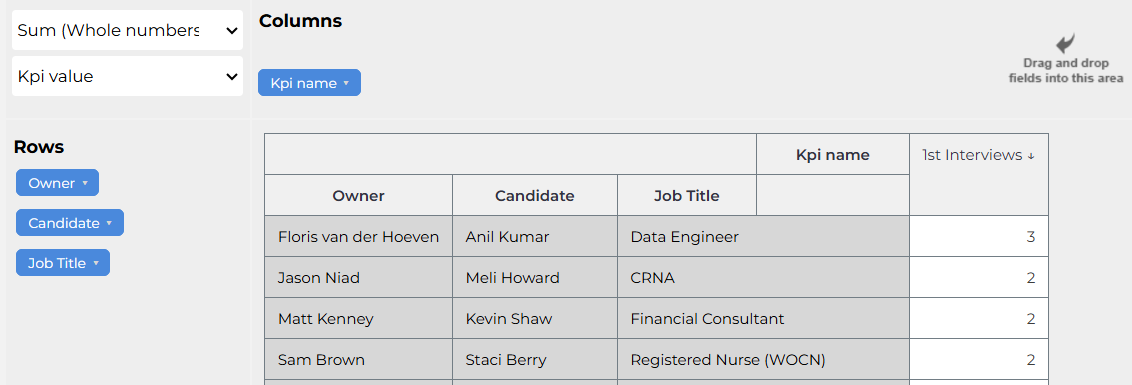
One of the most common data quality issues that Analytics can highlight is having multiple interviews with one candidate counting as a first Interview.
If you navigate over to Slice & Dice, select the 1st Interviews metric, the relevant group, and whichever timeframe you’re concerned with. Once the report has been run, drag in the blue tabs for “Candidate,” “Company,” and “Job Title” under Rows. If you then sort the results by clicking 1st Interviews, it will put candidates with multiple 1st Interviews at the same job at the top of the results. Click on the results to go to the offending record in the ATS.

Then you just need to figure out why this is happening! Sometimes, this will be due to the ATS email integration automatically logging an appointment, and then the consultant logs the same interview manually. Other times, consultants are logging interviews incorrectly. You can check out our article in the Knowledge Base for best practices on logging Interviews accurately in Analytics.
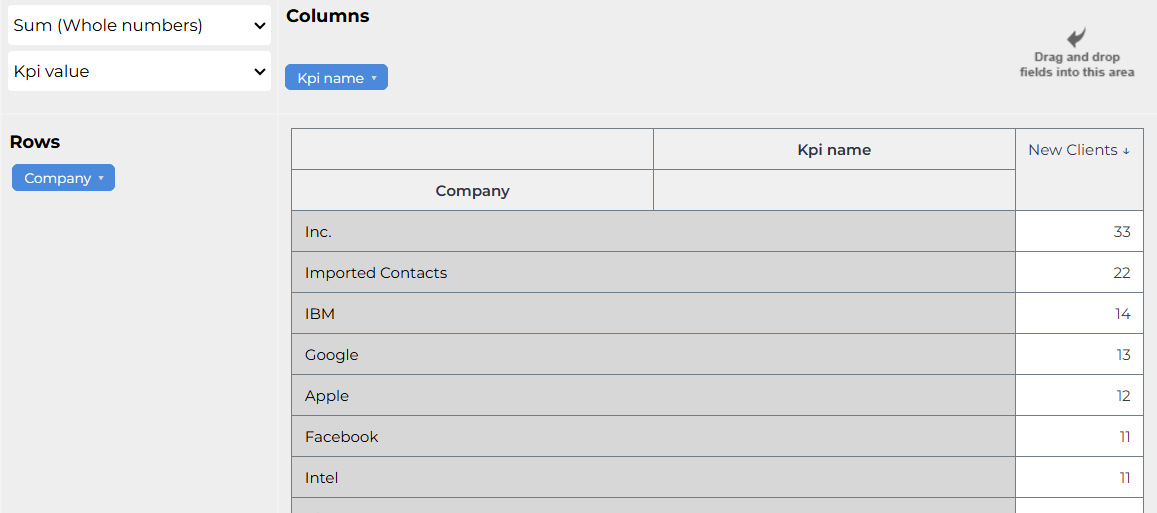
Slice & Dice can also be used to investigate other duplicate records, such as to find out if there are multiple Client records. Choose the metric “New Clients” and input a custom date range to go back multiple years. Change the tab from Owner to Company, and you’ll be able to see if anyone’s accidentally created a new Client record when one already existed. Hopefully, your team is doing better than our demo environment!


These are simple reports to run, and the method of doing so can apply to lots of different areas, such as finding candidates with duplicate records or if the same CV Send/Submission has been recorded multiple times.
Custom metrics
If the pre-made data quality metrics and Slice & Dice options don’t cover the specific example you’re looking for, then metric editing may be the answer.
A simple metric you can create yourself would be to find any client contacts who have been added to the system without contact details.
In the Edit Metrics tab, find your “New Client Contacts” metric, and click the kebab menu to select “Inherit from this metric.” This will duplicate this metric but leave your new metric linked to the original metric, so if you make any changes to the original metric (like adding visible columns), they’ll also apply to your new metric.
Then open the Config tab and scroll to “Filter.” You can add two conditions: select “Client Contact Email Address” and “Client Contact Phone Number” and set the operator for both to “is Blank.” This will filter the Client Contacts Added metric to only show contacts with no email address or phone number.


If your team is a little bit sneakier, though, and will put something in the field, even if it’s not a real phone number or email address, we can take this a step further.
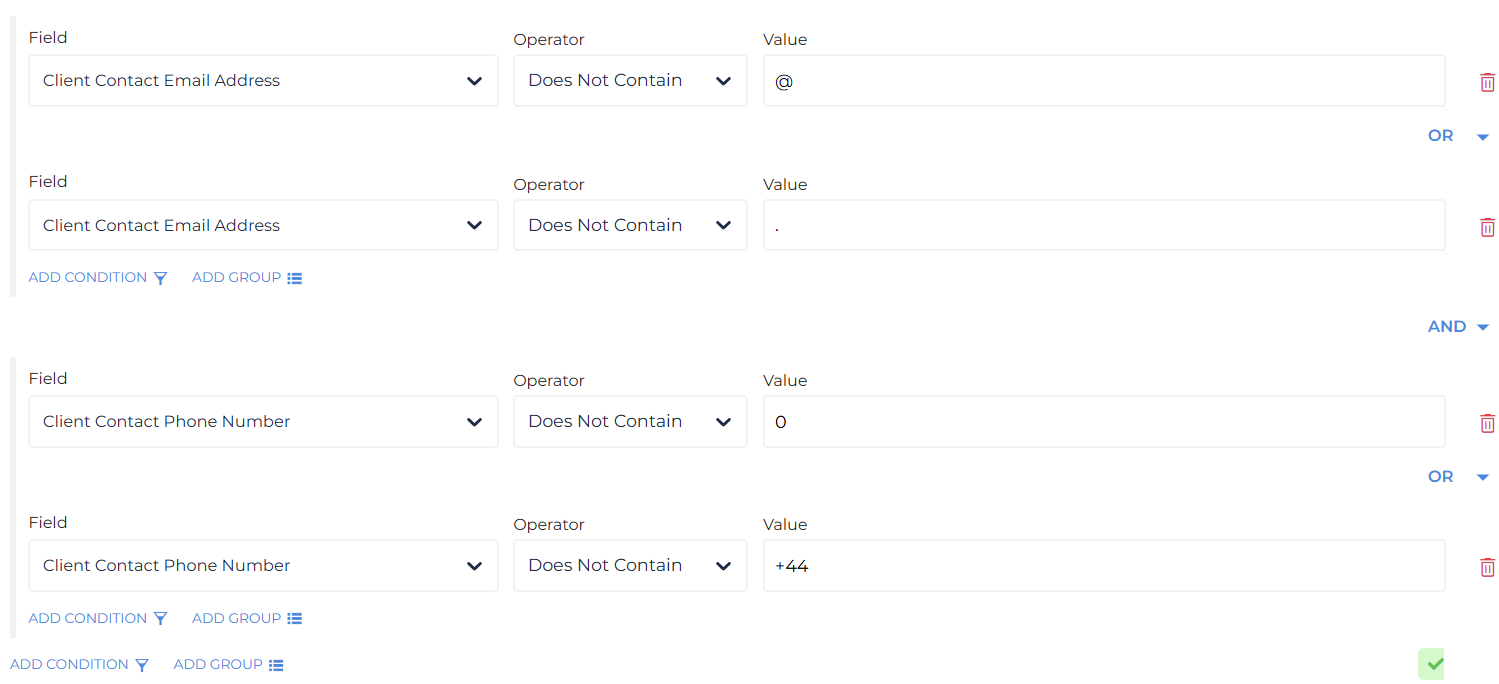
Set the operator instead to “Does not contain” and then specify “@” or “.”. No real email address is missing either of those, so this should help identify any others that need updating.
Phone number is trickier, and may depend on your region. If all of my client contacts are based in the UK, I could specify that each phone number contains either “0” or “+44”.

This metric will then show client contacts who have been added and have something in either of these fields but that isn’t usable information.

Now that you know the mistakes in your database that are throwing off your figures, it’s time to fix them and train your team so that new ones don’t pop up! If you have Automation, consider using our data hygiene playbook, or you can even use Data Loader in ATS native.
Check out this recent webinar for more tips on using ATS, Analytics, and Automation to improve data integrity.


 Bullhorn’s marketplace of 100+ pre-integrated technology partners gives recruitment agencies the tools they need to build a unique, future-proof solution.