Canvas Webinar Recap
On Dec. 6th, Canvas product marketing manager Sarah Ferguson hosted a webinar all about our new ad-hoc reporting suite, Bullhorn Canvas. If you missed the webinar or wanted a refresher on the information-filled session, you can watch the recorded webinar here or read the recap below.
Why Is It So Hard to Understand the Health of My Business?

There is no shortage of obstacles that get in the way of understanding the true health of your business.
It can be difficult to track employee performance in a timely or accurate way. There may be so much data at your disposal that it’s impossible to know where to focus your efforts. You may be operating off of old data that is no longer relevant to the true state of your business. Data may be inaccessible to team members that need it most or siloed away where it can’t be used to provide insight. Your resources might be improperly allocated because you don’t have the information necessary to determine where your team’s time and money can be best used.
What Questions Will Help Me Understand My Business?
To truly understand the state of your business, you should be asking yourself these questions.
- What type of new business is the best to target based on historical performance?
- What areas of my business need the most improvement?
- What areas of my business are performing very well?
- Who on my team is exceeding targets?
- Who on my team is underperforming?
Explore Every Dimension of Your Business With Bullhorn Canvas
Bullhorn Canvas is the ad-hoc reporting suite that enables you to answer the questions about your business that matter without any of the obstacles that so often prevent you from doing so.
With the ability to build any report, you can know your business inside and out. Use all of the data you choose, and the metrics that matter most to your business. All fields are custom, so you have the ability to create a report that answers the questions that are unique to your business. Your business isn’t generic, so why are your reports?
Bullhorn Canvas is built with a consumer-friendly interface, so you spend your time analyzing reports instead of running them. It’s also developed to be as accessible as possible. Reports are easily shared, so you can propagate your business intelligence by getting your insights into the hands of your coworkers.
Bullhorn Canvas in Action:
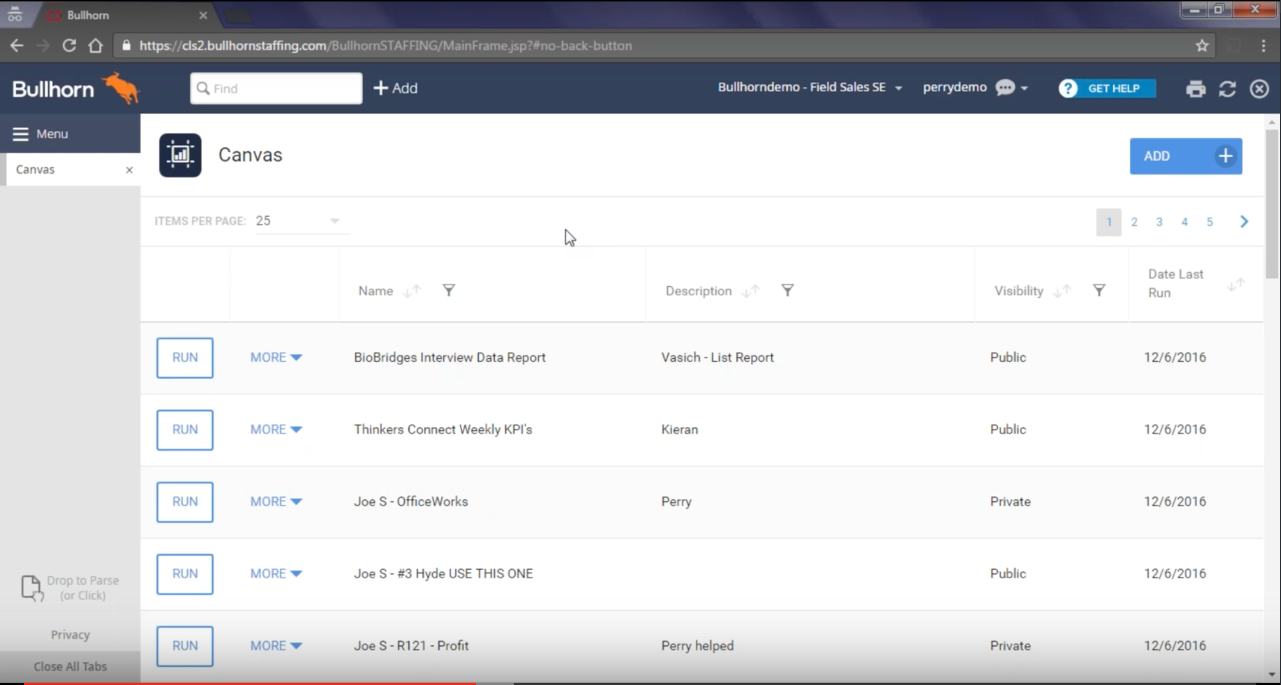
The webinar concluded with a sneak-peak demo of Bullhorn Canvas. Bullhorn’s Perry Livingston showcased the ease of creating custom reports in Canvas.
Because Bullhorn Canvas is meant to provide actionable insight that improves your business, a report might start with a question you might want to answer about the state of your business. For the demo, we asked these questions an executive at a staffing firm might have about the business.
- With which clients are recruiters investing the most of their time?”
- Where are our strongest client relationships?
- Where should recruiters invest more time growing client relationships?
Now that we have questions in mind, we can build a report to answer them. Go to “Add Report” in Canvas to build the report in Canvas Editor. You can drag and drop the pertinent data to make a custom report in no time. You have full freedom to determine the parameters and fields, which can be edited as needed. Canvas uses any custom fields you may use in Bullhorn. Any changes to these fields you make will be reflected in real time.
For this report, these metrics were chosen.
- Internal Submission Count
- Client Submission Count
- Interview Count
- Placement Count
- Job Count
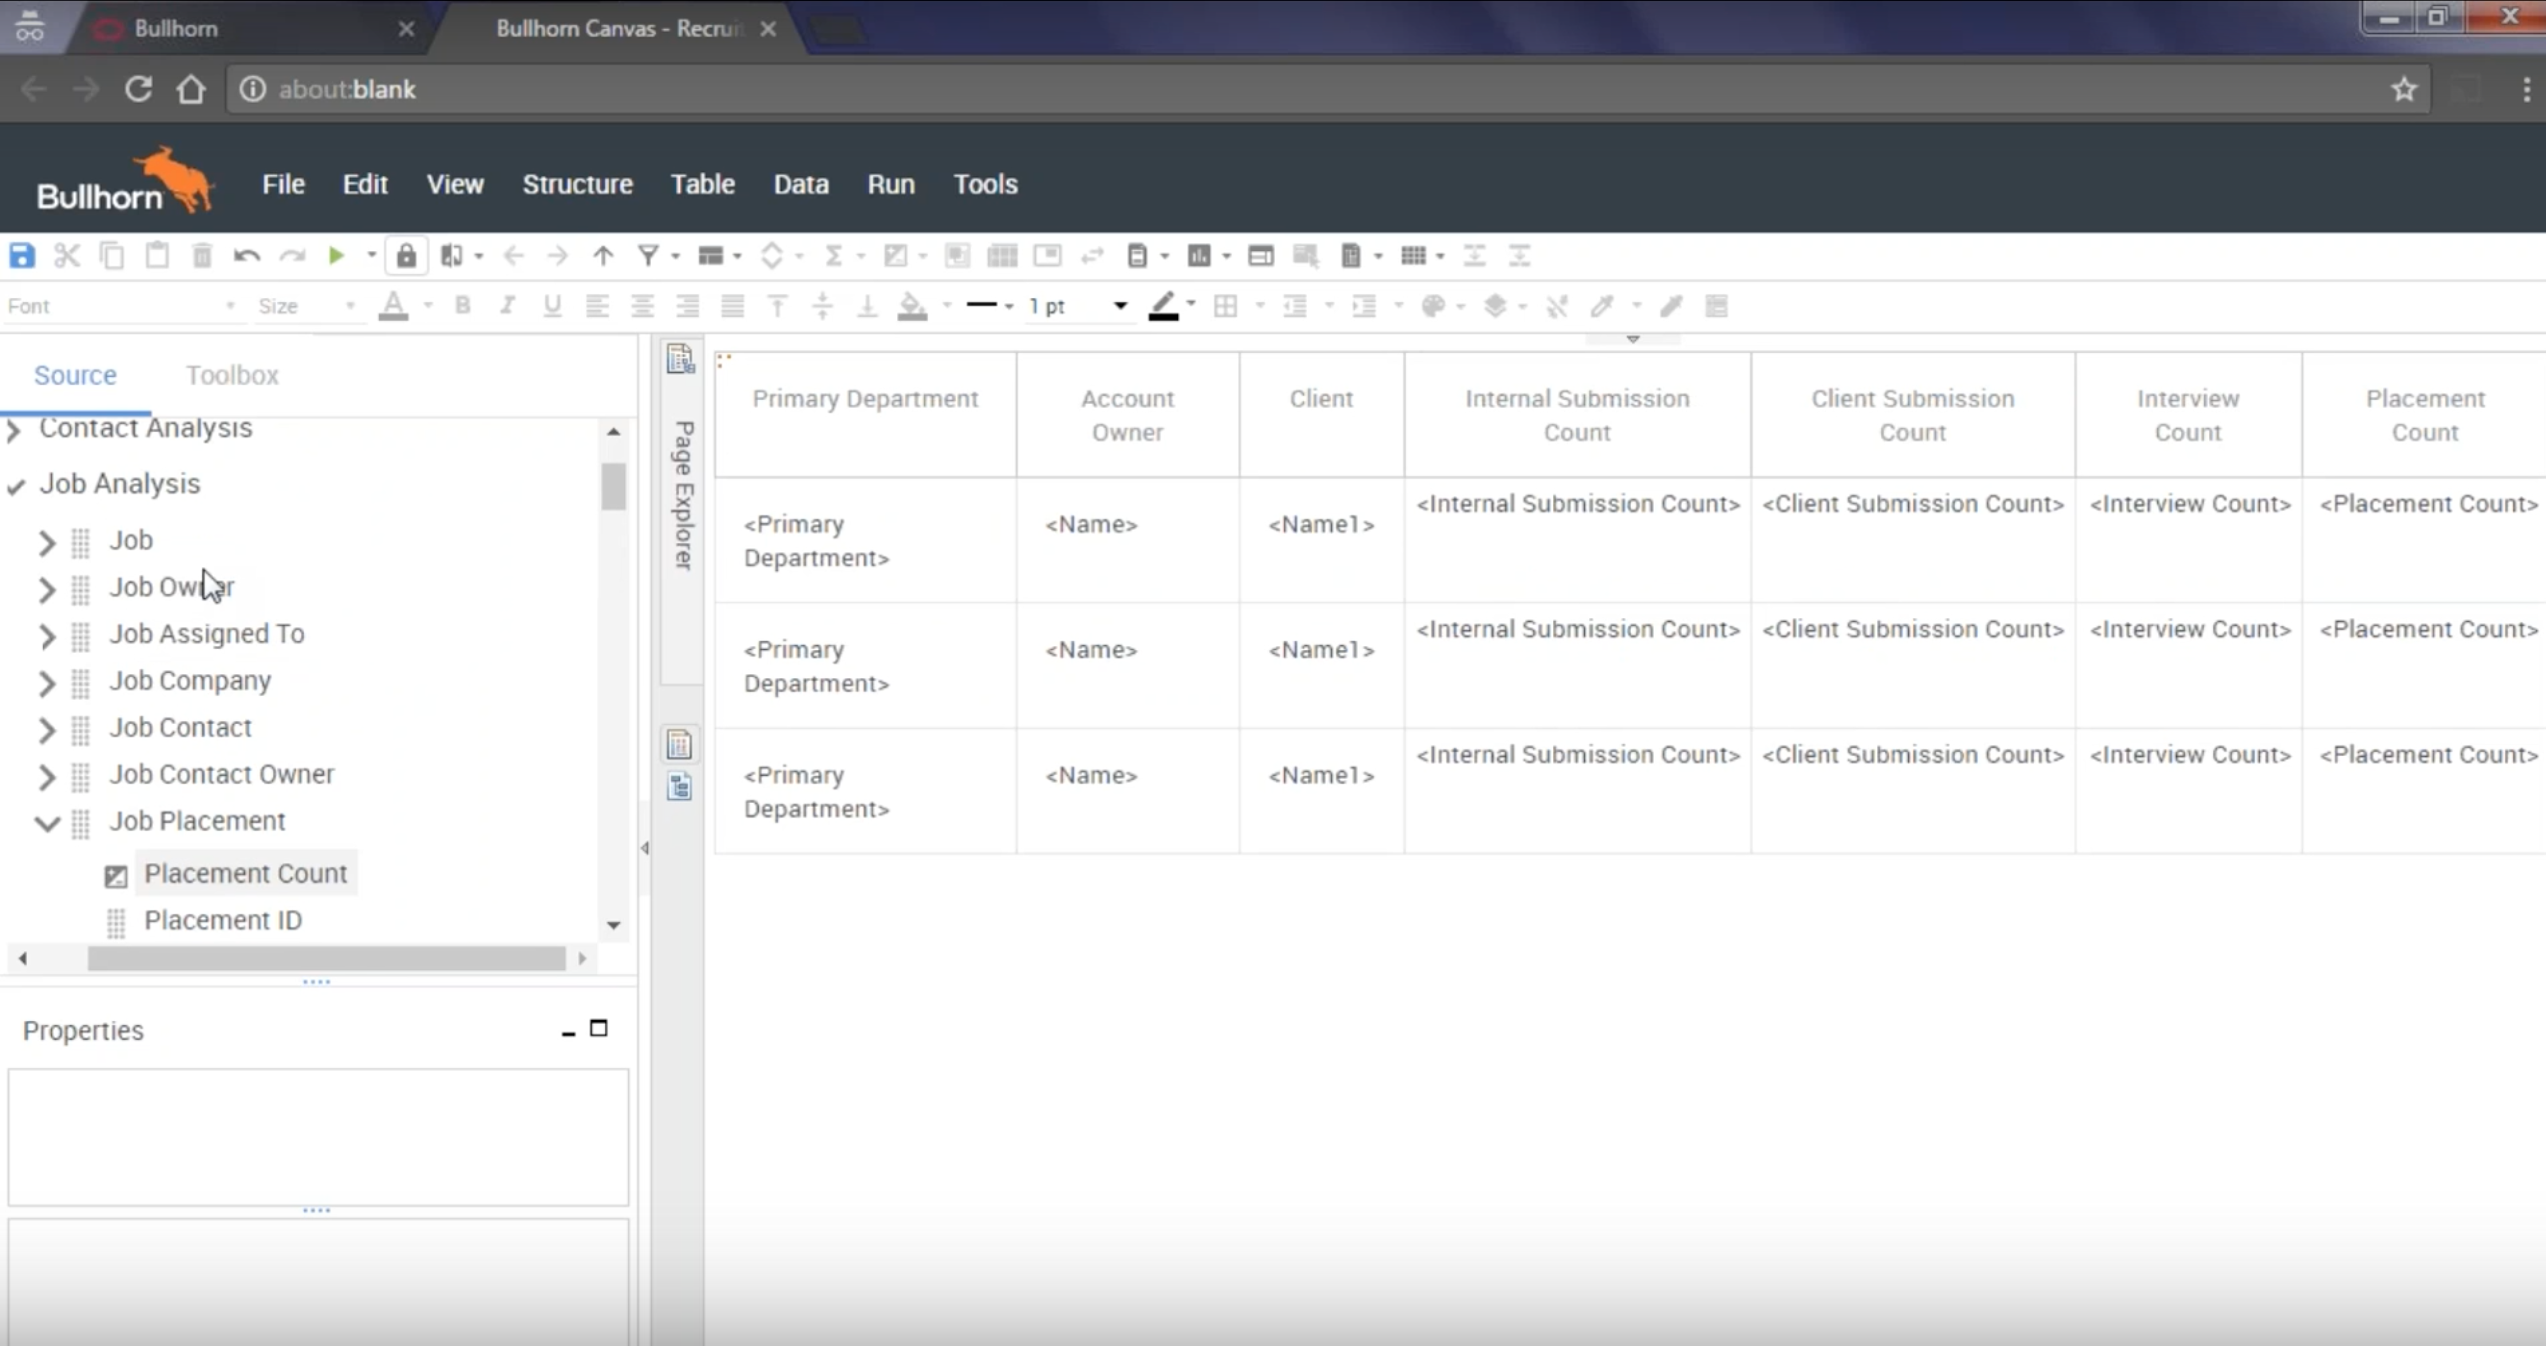
For clarity, the report is then grouped by department, owner, and client.
The report is then saved and is now ready to run!
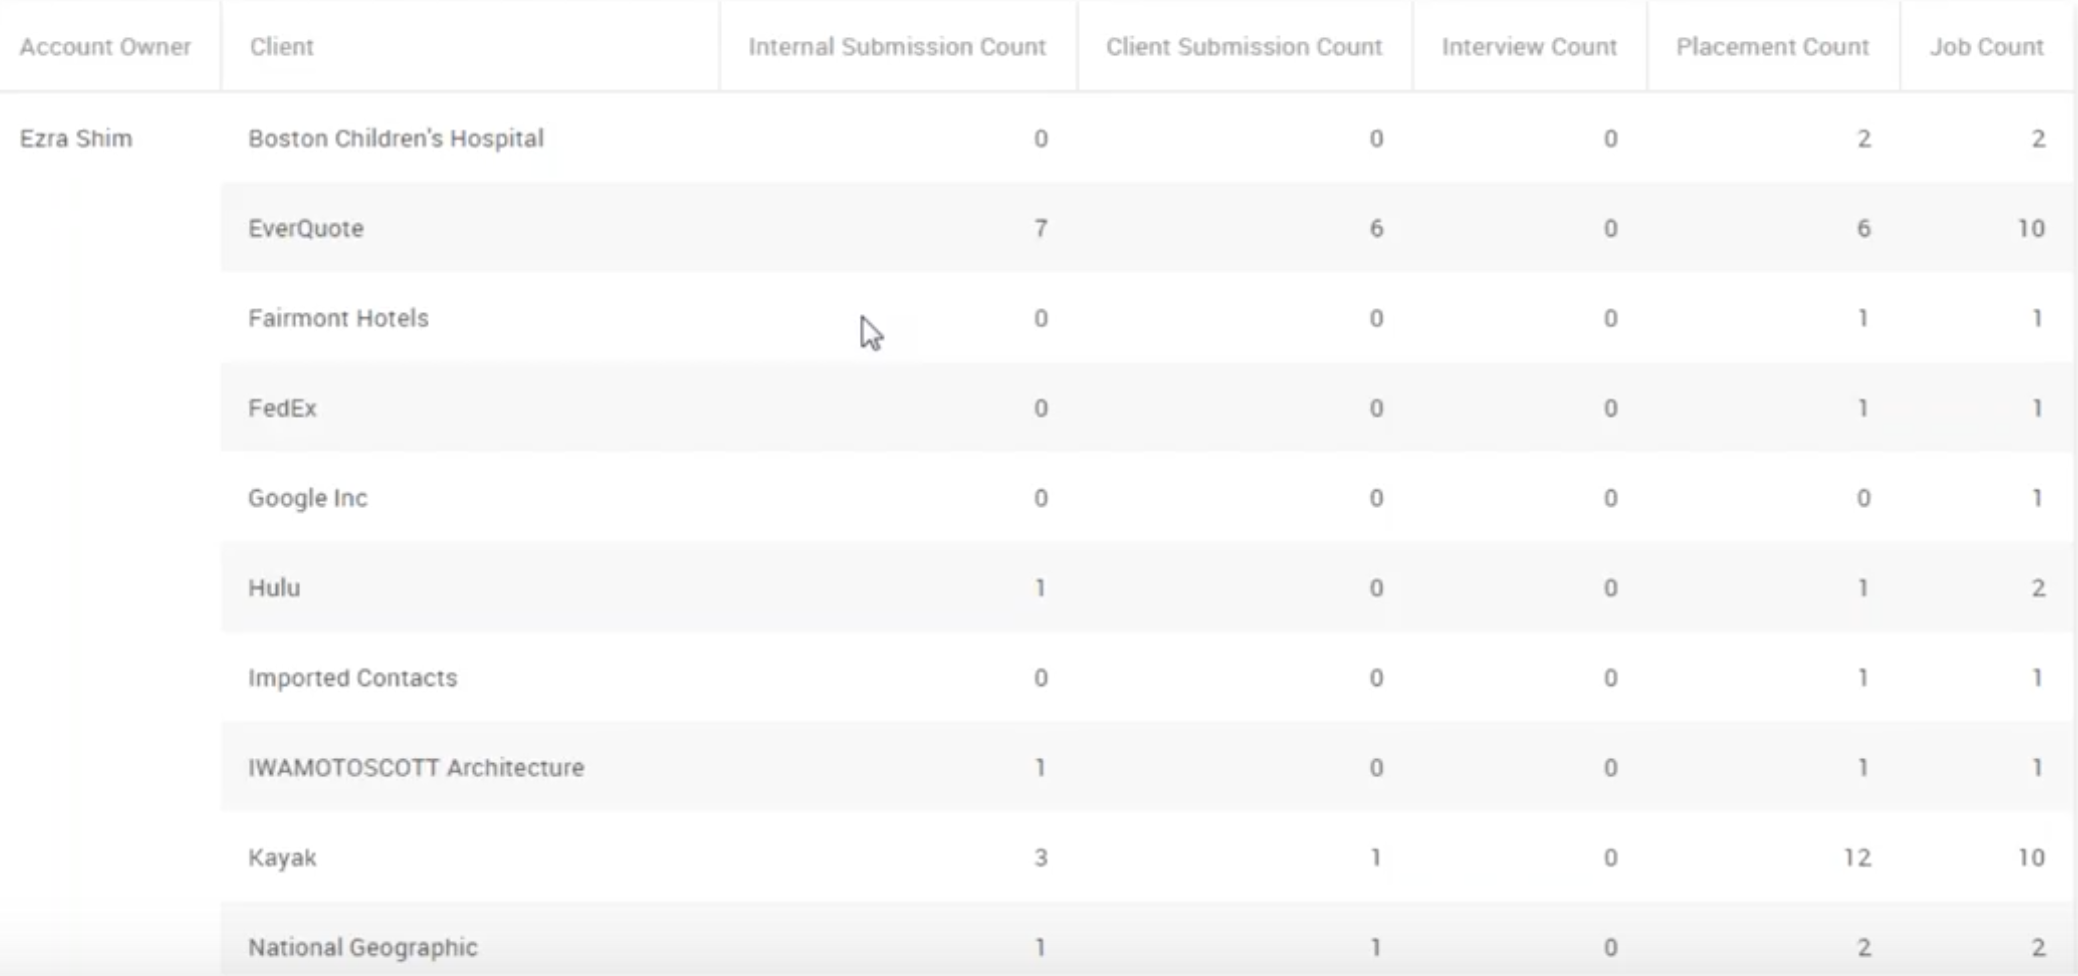
In minutes, you now have valuable information about recruiter activity that you can use to inform how your resources are allocated among different clients.
Want to Learn More About Canvas?
Visit the Canvas product page or call us at 617-478-9100.
